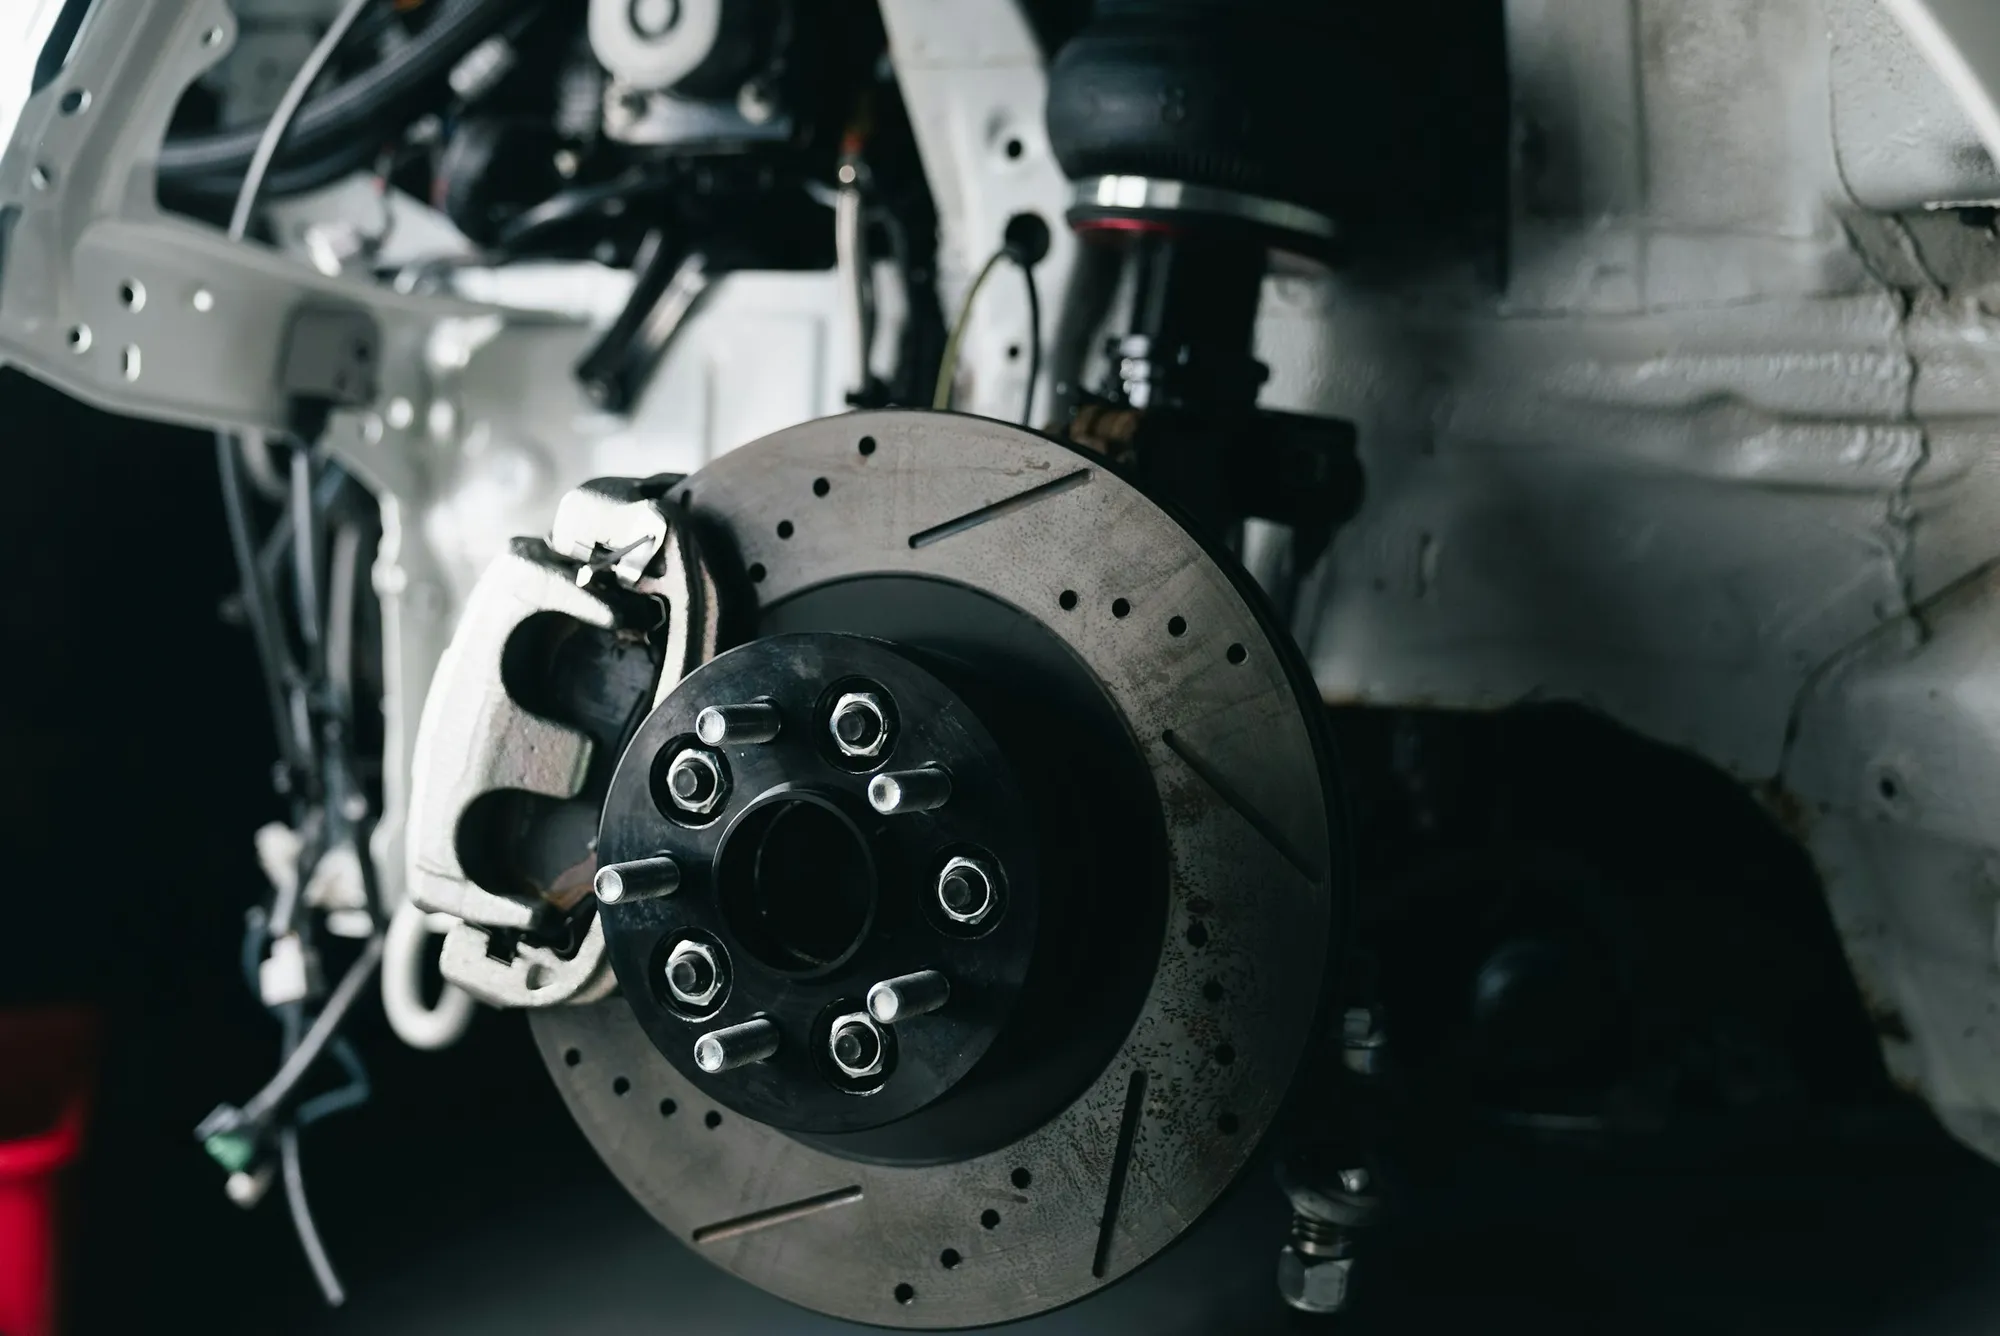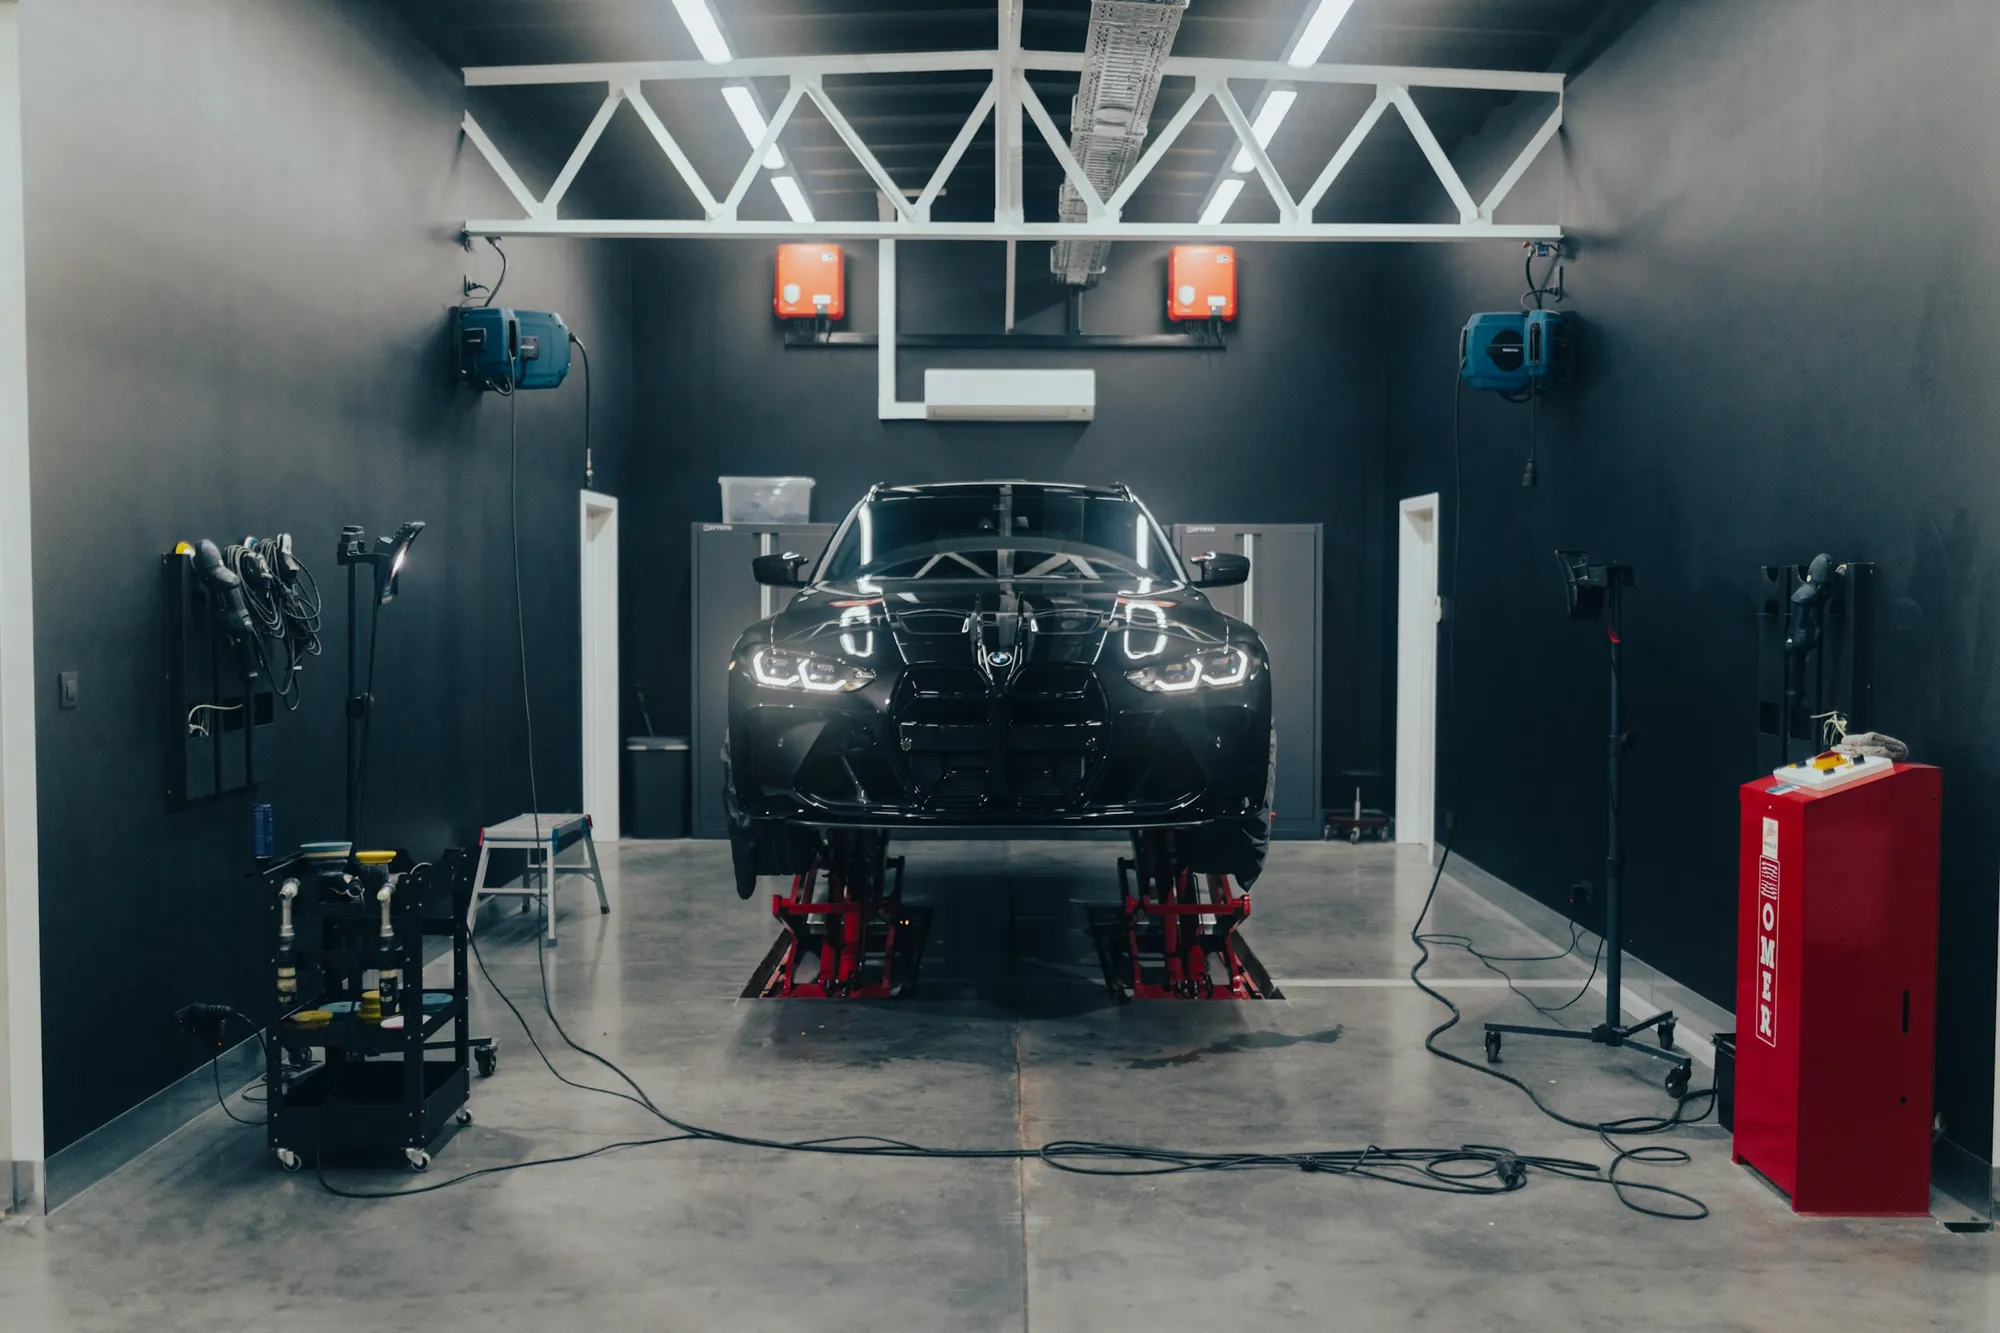
Photo: Lorenzo Hamers / Unsplash. A car in the workshop.
A dyno sheet is a measurement report. Behind the curve on the page sit a measuring method, a set of weather conditions and some processing between the sensor and the printout. Two sheets can only be compared when those things match, and a peak number without them is just a number.
What a chassis dyno measures
Dynojet's WinPEP 7 user guide explains the inertia method plainly. The dyno times each revolution of a heavy steel drum, works out how quickly the drum is accelerating, and calculates force from that acceleration and the drum's mass. Power reaches the drum through friction between the driven tire and the drum's surface, so the measurement is taken after the transmission, differential and tires have done their work. Dynojet WinPEP 7 user guide
Torque is a different matter. The guide notes that engine torque is not the same as torque at the drum, because the gearing changes the moment arm, and that the software needs the ratio of engine speed to drum speed to calculate it. That is why an RPM signal is required for torque graphs. Dynojet WinPEP 7 user guide If that signal is poor, the torque curve inherits the error, so ask how RPM was captured.
Not every dyno works the same way. Dynojet's 224xLC adds an eddy-current absorber for loaded tests, including step, sweep and closed-loop tests. Dynojet 224xLC Its hub dyno takes a different approach, capturing rotational forces directly at the wheel hub. Dynojet hub dyno Mustang Dynamometer builds its pitch around applying a load like the one a car sees on the road or track. Mustang Dynamometer Each design answers its own questions. Comparisons belong within one method, and ideally on one machine.
Correction is a model, not a measurement
Engines respond to the air they breathe. The Dynojet guide describes correction factors that use absolute barometric pressure, air temperature and humidity to estimate what the engine would make at sea level under standard conditions. Data can be displayed as measured, uncorrected, or corrected. Dynojet WinPEP 7 user guide
The same guide shows how much choice sits in that step. WinPEP 7 can display a run with SAE, DIN, EEC, JIS or STD correction, or uncorrected, and Dynojet notes that the SAE formula it used assumes a mechanical efficiency of 85 percent. It also points out that intake air can be heated by the engine and differ from ambient temperature. Dynojet WinPEP 7 user guide None of that makes corrected figures wrong. It makes them estimates built on stated assumptions, which is fine as long as both runs use the same ones.
Keep the labels straight, too. SAE J1349 is an engine power test code for as-installed net power, and SAE says it is meant to produce repeatable measurements that reflect real engine performance in customer service, with intentional biasing of tolerances prohibited. SAE J1349 A manufacturer's engine rating and a wheel figure from a chassis dyno describe different measurements. Converting one into the other with a favorite loss percentage creates precision that is not there.
Smoothing shapes what you see
Raw dyno data is noisy, and software smooths it. In WinPEP 7, smoothing removes noise from the raw data and offers six levels, from zero, which shows the most detail, to five, which shows the least, with level three as the default. Dynojet WinPEP 7 user guide
Heavier smoothing gives a cleaner-looking curve, and it also flattens short events. When a dip or spike matters to the diagnosis, ask to see the same run at a lower setting. When comparing two runs, make sure the smoothing level matches, along with the correction standard.
What a useful sheet includes
A sheet you can learn from carries its own context. Look for the date, the dyno make and model, the correction standard and smoothing level, the recorded air temperature, pressure and humidity, the gear used, the fuel and the source of the RPM signal. Air-fuel ratio or boost traces help if they were logged. Several consecutive runs say more than a single best pull, and a before-and-after comparison is easiest to trust when both runs come from the same dyno on the same day.
If a shop will not tell you how a number was produced, treat the number accordingly. The most useful figure on any dyno sheet is the one that repeats, and the change between two documented runs is worth more than the peak of either.
Technical explainer based on Dynojet's WinPEP 7 documentation, which describes that software's options; current dyno software may differ. TUNERS has not tested any vehicle on a dynamometer for this story.